Brief

Biodiversity in UrbanShift Cities
Comparable Indicators to Measure the Health of Nature in Urban Areas
These online reports, with interactive maps and figures, provide indicators to measure the state of biodiversity in UrbanShit cities based on comparable global datasets.
To help understand the status of sustainability in UrbanShift cities and identify existing and potential challenges, we have measured key baseline indicators for the program's 23 primary cities using comparable approaches. The indicators selected can help to establish targets aligned with three of the Global Environment Facility’s focal areas for its current investment cycle (GEF-7): biodiversity, climate change and land degradation. The reports presented here are focused on biodiversity.
Interactive reports on biodiversity indicators for the primary UrbanShift cities will be added to this page once complete. Please click on the name of the city to access the relevant report.
- Argentina
- Brazil
- Costa Rica
- China
- India
- Indonesia
- Morocco
- Rwanda
- Sierra Leone
Data to measure these indicators is mainly derived from global open-source datasets and the resulting analyses and their specific input datasets will be published openly on the UrbanShift Data Hub. The objective of the indicators is to assess the status and trends of change within each city, providing information to distinguish patterns within and between cities and assist in detecting problems and defining solutions. The outputs will be disseminated to local and national governments and the UrbanShift partners to help them gain a better understanding of the cities’ capacity, opportunities and needs as it relates to sustainability. We will update these measurements at least once before the end of the program to reflect any changes.
Learn more
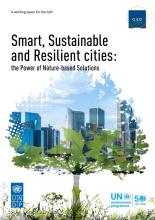
Smart, Sustainable and Resilient Cities
This working paper investigates the potential of nature-based solutions to help build smart, sustainable and resilient cities, drawing from the experience of G20 countries and beyond.

Strategic City Planning with Nature: Assessing Urban Biodiversity in San José, Costa Rica
UrbanShift’s geospatial analysis for the San José metropolitan region will support urban actors to incorporate biodiversity into planning mechanisms and transform decision-making processes toward valuing the benefits of nature.
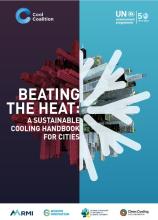
Beating the Heat
This handbook was launched at COP26 and provides case studies from cities around the world that demonstrate how to sustainably tackle the urban heat island effect.
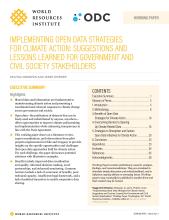
Implementing Open Data Strategies for Climate Action
City leaders can utilize this resource to understand the benefits of open data for climate action and better advocate for data publication processes.
